
Page 36 - 2021PSF-ResilientCoastsForSalmon-NewLogo-Primer-Web
P. 36
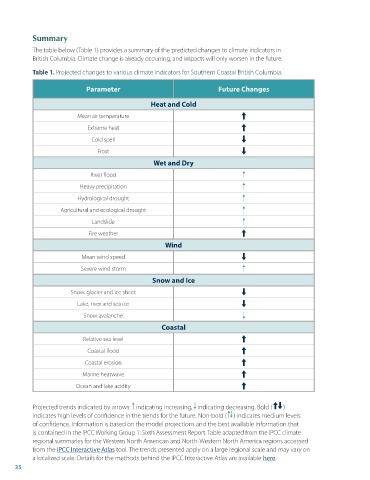
Summary

            The table below (Table 1) provides a summary of the predicted changes to climate indicators in
            British Columbia . Climate change is already occurring, and impacts will only worsen in the future .

            Table 1 . Projected changes to various climate indicators for Southern Coastal British Columbia .

                              Parameter                                  Future Changes

                                                   Heat and Cold

                           Mean air temperature

                              Extreme heat
                               Cold spell
                                 Frost

                                                    Wet and Dry
                               River flood

                           Heavy precipitation
                           Hydrological drought
                     Agricultural and ecological drought

                               Landslide
                              Fire weather

                                                        Wind
                            Mean wind speed

                            Severe wind storm
                                                   Snow and Ice

                        Snow, glacier and ice sheet
                           Lake, river and sea ice
                             Snow avalanche
                                                      Coastal

                             Relative sea level

                              Coastal flood
                             Coastal erosion
                            Marine heatwave

                          Ocean and lake acidity


            Projected trends indicated by arrows:   indicating increasing,   indicating decreasing . Bold (    )
            indicates high levels of confidence in the trends for the future . Non-bold (   ) indicates medium levels
            of confidence . Information is based on the model projections and the best available information that
            is contained in the IPCC Working Group 1: Sixth Assessment Report . Table adapted from the IPCC climate
            regional summaries for the Western North American and North-Western North America regions accessed
            from the IPCC Interactive Atlas tool . The trends presented apply on a large regional scale and may vary on
            a localized scale . Details for the methods behind the IPCC Interactive Atlas are available here .
      35